Maple syrup is strongly associated with Canada, and especially with Quebec. That association is grounded in real production scale: Quebec alone accounted for 90.0% of Canadian maple syrup production in 2025. But the geography of maple syrup is wider than one province, one country or one famous U.S. state. [1][2]
Canada records commercial production in Quebec, New Brunswick, Ontario and Nova Scotia. In the United States, the U.S. Department of Agriculture reported maple syrup production across 13 states in 2026, led by Vermont but extending through New England, New York, parts of the Great Lakes region and several other northern and eastern states. [3]
For European consumers, the useful picture is therefore a North American production geography with strong regional centres, not a simple map in which Canada makes maple syrup and the United States does not.
The short answer: where does maple syrup come from?
The two largest national maple industries covered by the official sources used by MapleSyrup.eu are Canada and the United States. In the synchronized 2025 comparison used elsewhere on the site, Canada produced 18.9 million US gallons, while the United States produced 5.701 million gallons. [1][3][7]
Within those countries, production is unevenly distributed.
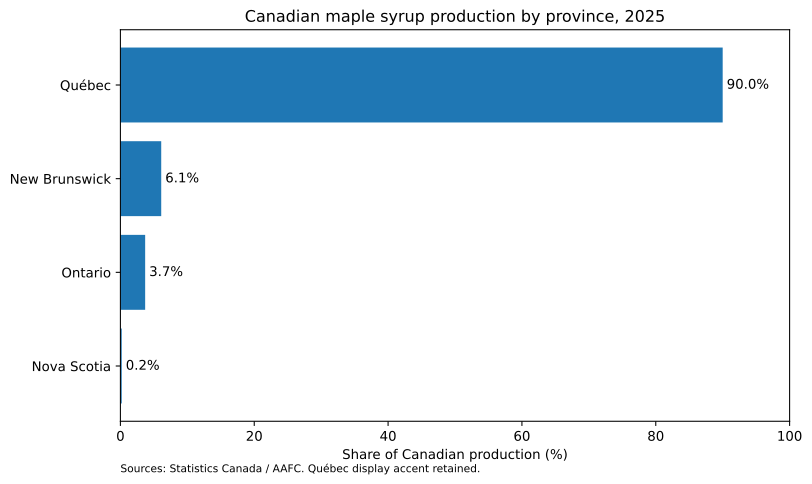
Canada is extraordinarily concentrated in Quebec. In 2025, the provincial shares were Quebec 90.0%, New Brunswick 6.1%, Ontario 3.7% and Nova Scotia 0.2%. [2]
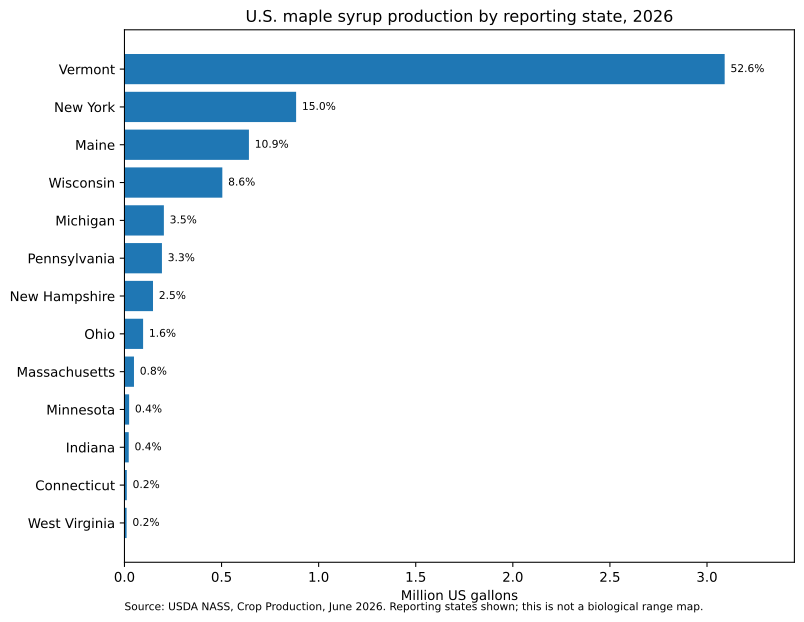
The United States is also concentrated, but less completely in one region. Vermont produced 52.6% of U.S. output in 2026, followed by New York at 15.0%, Maine at 10.9% and Wisconsin at 8.6%. Nine other states made up the rest of the USDA-reported total. [3]
That is the essential geography: a dominant Quebec centre in Canada and a Vermont-led but broader state network in the United States.
Canadian production by province · 2025
Why is maple syrup production concentrated in this part of North America?
Maple syrup production depends on more than the presence of a maple tree. Producers need trees that yield usable sap, a seasonal climate that supports sap flow, and the infrastructure and know-how to collect and concentrate that sap into syrup.
The physiology is more complicated than the familiar phrase "cold nights and warm days" suggests. Peer-reviewed research on sugar maple and red maple shows that freeze-thaw processes can generate positive pressure in the xylem, helping explain the distinctive sap-exudation behaviour used during the sugaring season. [4]
That mechanism helps explain why seasonal temperature patterns matter, but this page should not turn it into a simplistic weather formula. The timing and strength of sap flow vary, and the current MapleSyrup.eu research does not define a single precise climate line beyond which maple syrup is either possible or impossible.
For V1, the most reliable map is therefore a map of documented production, not an invented map of absolute biological possibility.
Canada: maple production is overwhelmingly centred in Quebec
Canada produced 18.9 million US gallons of maple syrup in 2025, according to Statistics Canada. Quebec produced about 17.0 million gallons and accounted for 90.0% of the national total. [1]
The remaining Canadian production came from New Brunswick, Ontario and Nova Scotia in the official 2025 data used for this project. [2]
| Province | 2025 production | Share of Canadian production |
|---|---|---|
| Quebec | about 17.0m US gal | 90.0% |
| New Brunswick | about 1.16m US gal | 6.1% |
| Ontario | about 690k US gal | 3.7% |
| Nova Scotia | about 42k US gal | 0.2% |
This concentration is so strong that people sometimes use "Canadian maple syrup" and "Quebec maple syrup" almost interchangeably. That is understandable as shorthand, but it is not technically correct. About one in ten units of Canadian 2025 production came from outside Quebec. [2]
New Brunswick is the second-largest province in the current production snapshot, while Ontario also has meaningful production. Nova Scotia's national share is small, but its presence in the data is a useful reminder that Canadian maple production extends into Atlantic Canada.
For launch, MapleSyrup.eu does not need to manufacture equal-depth profiles for all four provinces. The geographic page should show their actual scale and link readers to the dedicated Canada page for the fuller national context.
The United States: Vermont leads, but production extends well beyond Vermont
Vermont is the best-known U.S. maple origin and the country's leading producing state. USDA recorded 3.091 million gallons there in 2026, equal to 52.6% of the national total. [3]
That still leaves nearly half of U.S. production outside Vermont.
| State | 2026 production | Share of U.S. total |
|---|---|---|
| Vermont | 3.091m gal | 52.6% |
| New York | 884k gal | 15.0% |
| Maine | 641k gal | 10.9% |
| Wisconsin | 504k gal | 8.6% |
| Michigan | 203k gal | 3.5% |
| Pennsylvania | 193k gal | 3.3% |
| New Hampshire | 147k gal | 2.5% |
| Ohio | 96k gal | 1.6% |
| Massachusetts | 49k gal | 0.8% |
| Minnesota | 24k gal | 0.4% |
| Indiana | 22k gal | 0.4% |
| Connecticut | 12k gal | 0.2% |
| West Virginia | 11k gal | 0.2% |
New York, Maine and Wisconsin are particularly important to the wider U.S. picture. Together with Vermont, those four states produced about 87.1% of U.S. maple syrup in 2026. [3][6]
The presence of Wisconsin and Michigan is useful for European readers because it prevents a common mental shortcut in which U.S. maple is treated as a purely New England product. The USDA data show a broader northern production geography.
At the same time, the list above needs a methodological label. It is the set of states for which USDA reported production in its 2026 maple table. It should not be republished as a scientific boundary declaring that maple syrup cannot be made elsewhere.
Quebec and Vermont are both centres - but in different ways
Quebec and Vermont are the dominant production centres within their respective countries, but their roles are not identical.
Quebec's share of Canadian production was 90.0% in 2025. Vermont's share of U.S. production was 52.6% in 2026. These figures come from different crop years, so they should be used to illustrate concentration patterns, not as a direct same-year production contest. [1][3]
The difference is still informative. Canada's current maple geography is much more heavily concentrated in its leading province, while the U.S. industry has a larger share spread among additional states.
That geographic structure says nothing by itself about which region makes "better" syrup. A large production share can reflect climate, forest resources, industry history, producer organisation, investment and commercial scale. It is not a sensory score.
For quality questions, the more relevant information is the actual product and its grade, colour/flavour class, condition and origin details. The dedicated Canada-vs-U.S. and Grades pages handle those comparisons directly.
U.S. production by reporting state · 2026
Does a maple syrup map show where syrup can be made - or where it is being made?
This distinction matters.
A statistical production map shows where production is reported. It can tell us that Quebec, New Brunswick, Ontario and Nova Scotia make up the Canadian production captured in the 2025 official data, and that USDA reported production in 13 U.S. states in 2026. [2][3]
It does not automatically define the full biological range of suitable maple trees or every place where a small producer might make syrup. Nor does the absence of a region from a particular agricultural statistics table prove that production there is impossible.
MapleSyrup.eu should therefore avoid a sharp line labelled "maple syrup can only be made here" unless a separate botanical and climatic analysis establishes that boundary. The launch map can be more accurate by doing less: show the officially documented production regions and their current scale, with the data year clearly stated.
That approach also makes the map easier to maintain. When annual production changes, the underlying data can be updated without pretending that the natural geography itself has suddenly changed.
Does origin determine flavour or quality?
No. Geography is useful information, but it is not a quality hierarchy.
Quebec, Vermont, New York, New Brunswick, Maine, Ontario or Wisconsin can all describe meaningful origins. They do not tell a buyer, on their own, whether a particular bottle will be lighter or darker, delicate or robust, or better suited to a particular use.
Modern Canadian and U.S. Grade A systems use closely aligned colour and flavour classes - Golden/Delicate, Amber/Rich, Dark/Robust and Very Dark/Strong. Those product characteristics are more direct guides to flavour intensity than a national stereotype. [5][6]
This is why MapleSyrup.eu separates three questions:
- Where was it made? - origin and geography.
- What is it? - genuine maple syrup versus a different syrup product.
- What grade and flavour profile does it have? - product classification and sensory description.
Keeping those questions separate makes origin more useful, not less. It lets readers appreciate regional identity without asking geography to prove something it cannot.
The evidence-based takeaway
Maple syrup has a distinct North American production geography, but it is broader than its two most famous place names.
In Canada, Quebec is overwhelmingly dominant, accounting for 90.0% of production in 2025, with additional production in New Brunswick, Ontario and Nova Scotia. In the United States, Vermont is the leader, but USDA reported production across 13 states in 2026, with New York, Maine and Wisconsin also contributing substantial volumes. [1][2][3]
Seasonal freeze-thaw physiology helps explain why this northern geography matters, but official agricultural statistics are evidence of actual recorded production - not a perfect biological boundary map. [4]
For European readers, the simplest accurate conclusion is therefore: Canada is the larger maple-producing country, Quebec and Vermont are major regional centres, and the real maple map extends well beyond either one.
Sources & reading notes
Numbered references belong to this article. Dates, definitions and limitations matter.
- Statistics Canada
The Daily - Maple products, 2025 ↗2025 crop; corrected 16 Dec 2025 · Corrected 2025 production and annual change.
- Agriculture and Agri-Food Canada
Statistical overview of the Canadian maple industry, 2025 ↗2025 data; published 2026 · Canadian exports; Germany volume/value shares.
- USDA National Agricultural Statistics Service
Crop Production, June 2026 ↗2025 national / 2026 state data used · US production; Vermont 2026 production.
- Maryam Zarrinderakht et al.
Experimental and computational comparison of freeze-thaw-induced pressure generation in red and sugar maple ↗Tree Physiology 44(4), 2024; published 11 Jan 2024 · Peer-reviewed physiology of freeze-thaw sap exudation; supports cautious mechanism explanation.
- Canadian Food Inspection Agency
Canadian Grade Compendium: Volume 7 - Maple Syrup ↗Current checked 10 Sep 2026 · Grade names and colour classes.
- USDA Agricultural Marketing Service
United States Standards for Grades of Maple Syrup ↗Current standard used in dossier · US Grade A colour and flavour classes.
USDA National Agricultural Statistics Service
Crop Production, June 2026 ↗2025 national / 2026 state data used · US production; Vermont 2026 production.
- USDA National Agricultural Statistics Service
Crop Production, June 2026 ↗2025 national / 2026 state data used · US production; Vermont 2026 production.
Download the complete source register (CSV) ↓ · Our methodology